

Investing in Emerging Markets
INVESTMENT COMMITTEE COMMENTARY May 2024
Stocks rebounded from a disappointing April and closed higher in May. Since last October, the S&P 500 has generally moved higher and is at or near all-time highs. There are four drivers to the positive equity performance: expectations for Federal Reserve (Fed) rate cuts, falling inflation, steady economic growth, and the strength and price momentum of technology stocks. The latest data from these four areas were sufficiently strong to move equities higher.
Inflation data reported stubborn, but slightly improved, prices. The Consumer Price Index (CPI) rose 3.4% for the 12 months ended in April (3.5% for the year ended in March), while the Personal Consumption Expenditures Price Index was unchanged at 2.7%. Consumer spending slowed more than expected, coming in at a 2.0% increase in the first quarter compared to 3.3% in the fourth quarter.
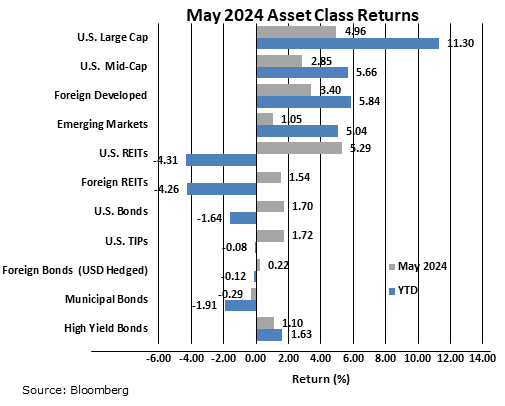
The S&P 500 rose 5% in May led by the technology sector. Other equity asset classes also had positive monthly performance. Foreign developed stocks gained 3.4% and emerging market equities gained 1.1%. Interest rate sensitive U.S. REITs rose 5.3% although year-to-date performance remains negative.
Bond prices rose in April as the yield on 10-year Treasuries fell from 4.69% to 4.51%. The Bloomberg U.S. Aggregate Bond Index rose 1.5% during the month. Other bond sub-indexes also rose in May with the exception of municipal bonds which were modestly lower.
Investing in Emerging Markets
The $8.4 trillion emerging markets (EM) asset class includes stocks from over 20 countries and represents approximately 10% of the world market capitalization. China, India and Taiwan represent the three largest countries in the category and together account for more than half of the EM market capitalization.
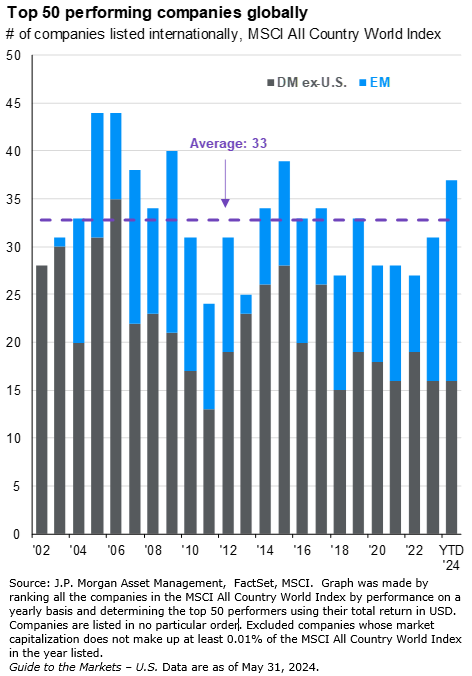
While recent S&P 500 performance has more often outpaced foreign developed and EM stocks, the majority of the top 50 performing companies globally have been foreign developed and EM stocks. The following chart illustrates this point and that emerging markets companies can also have strong total returns. The combination of foreign developed stocks (“DM ex-U.S.” in grey) and EM stocks (in blue) have made up on average 33 of the 50 best performing companies in the world since 2002.
By far, the largest constituent of the emerging market index is microchip maker, Taiwan Semiconductor Manufacturing Company (TSMC). This company represents approximately 9% of the EM index and is well known globally. Of note, trending artificial intelligence company NVIDIA is closely tied to TSMC as a trading partner. Also, various analyst reports indicate that Apple accounted for approximately 25% of TSMC revenue in 2023. Because emerging markets businesses represent a meaningful and important component of the overall global economy, JMG recommends an allocation to the EM asset class. This allocation adds diversification to the portfolio, while also capturing the performance of the top performing emerging markets stocks.
In recent years, investor sentiment towards emerging markets has been somewhat tepid. Economic growth in China has slowed. Other emerging markets countries such as India, Taiwan, Mexico and Brazil have differing economic conditions and global trade has changed in a post-COVID world. Emerging market stocks should benefit from global monetary easing and stronger EM economic growth from a growing middle class and favorable demographics.
JMG’s strategic equity allocation includes a “home field bias” to U.S. stocks over foreign developed and emerging markets stocks by a two-to-one ratio. Since the 2008 financial crisis, U.S. stocks have been outperforming and, as a result, become more expensive relative to emerging markets. This “premium” may be warranted by geopolitical risks and, for that reason, we are not currently planning to increase our allocation to emerging markets. That said, if central banks eventually ease monetary policy and global growth improves, it would not be surprising to see emerging markets perform well going forward.
If you have any questions, please consult your JMG Advisor.
Important Disclosure
Please remember that past performance may not be indicative of future results. Different types of investments involve varying degrees of risk, and there can be no assurance that the future performance of any specific investment, investment strategy, or product (including the investments and/or investment strategies recommended or undertaken by JMG Financial Group Ltd. (“JMG”), or any non-investment related content, made reference to directly or indirectly in this writing will be profitable, equal any corresponding indicated historical performance level(s), be suitable for your portfolio or individual situation, or prove successful. Due to various factors, including changing market conditions and/or applicable laws, the content may no longer be reflective of current opinions or positions. Moreover, you should not assume that any discussion or information contained in this writing serves as the receipt of, or as a substitute for, personalized investment advice from JMG. To the extent that a reader has any questions regarding the applicability of any specific issue discussed above to his/her individual situation, he/she is encouraged to consult with the professional advisor of his/her choosing. JMG is neither a law firm, nor a certified public accounting firm, and no portion of the content provided in this writing should be construed as legal or accounting advice. A copy of JMG’s current written disclosure Brochure discussing our advisory services and fees is available upon request. If you are a JMG client, please remember to contact JMG, in writing, if there are any changes in your personal/financial situation or investment objectives for the purpose of reviewing/evaluating/revising our previous recommendations and/or services, or if you would like to impose, add, or to modify any reasonable restrictions to our investment advisory services. JMG shall continue to rely on the accuracy of information that you have provided.
To the extent provided in this writing, historical performance results for investment indices and/or categories have been provided for general comparison purposes only, and generally do not reflect the deduction of transaction and/or custodial charges, the deduction of an investment management fee, nor the impact of taxes, the incurrence of which would have the effect of decreasing historical performance results. It should not be assumed that your account holdings correspond directly to any comparative indices. Indices are not available for direct investment.
Market Segment (index representation) as follows: U.S. Large Cap (S&P Total Return); U.S. Mid-Cap (Russell Midcap Index Total Return); Foreign Developed (FTSE Developed Ex U.S. NR USD); Emerging Markets (FTSE Emerging NR USD); U.S. REITs (FTSE NAREIT Equity Total Return Index); Foreign REITs (FTSE EPRA/NAREIT Developed Real Estate Ex U.S. TR); U.S Bonds (Bloomberg US Aggregate Bond Index); U.S. TIPs (Bloomberg US Treasury Inflation-Linked Bond Index); Foreign Bond (USD Hedged) (Bloomberg Global Aggregate Ex US TR Hedged); Municipal Bonds (Bloomberg US Municipal Bond Index); High Yield Bonds (Bloomberg US Corporate High Yield Index).