

Asset Allocation – Positioning for Rate Cuts
INVESTMENT COMMITTEE COMMENTARY July 2024
At the beginning of August, global equity markets experienced a broad “risk off” decline. The ten-year Treasury yield fell to 3.78%. Japanese equites were down about twice as much as other developed markets as the Bank of Japan announced rate hikes. In our opinion, what is driving the sell-off is a combination of profit taking, the covering of extended positions by select market participants, and a broad recognition of risks shifting from inflation towards slowing economic growth. The stability of high-quality fixed income during this period of volatility supports our philosophy of prudent diversification. While the extent of the sell-off is yet unclear, we continue to monitor for investment and tax planning opportunities which may present themselves during periods of market dislocation.
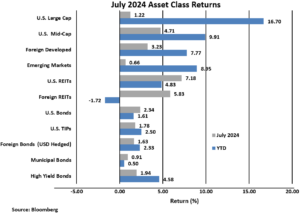
Stocks closed mostly higher in July with the S&P 500 up 1.2%. However, technology (tech) shares, including AI stocks, which had been a bellwether for much of the year, retreated in July. Broader market equities fared better, especially small cap stocks measured by the Russell 2000® Index which rose 10.2%.
As July closes, investors are watching for interest rate cuts by the Federal Reserve (Fed). The Fed has a dual mandate to promote stable prices and maximum employment. Chair Powell has given indications of a rate cut in September, not so much because inflation is fully under control, but because of worries about economic growth. A signal of slowing economic growth came from the July Purchasing Manager’s Index (PMI) reading of 48.7 (down from 49.2 the previous month), which is an indication the U.S. manufacturing sector is experiencing a contraction. Also, the most recent jobs report released on August 2nd showed that both civilian and government components of the labor market have softened. The question for markets in the second half of 2024 is whether the Fed will cut rates in time to avoid a recession and to achieve a “soft economic landing”.
Inflationary data showed price pressures stabilized in June. The year-over-year rate of increase in both the Consumer Price Index (CPI) and the Personal Consumption Expenditures (PCE) Price Index declined compared to the previous month. Prices for commodities that are prevalent for most households, such as food at home, gasoline, new and used motor vehicles, and apparel, changed very little over the year.
Nearing the midpoint of second quarter corporate earnings season, S&P 500 companies are reporting mixed results. About 41% of the S&P 500 companies have reported results with 78% reporting earnings per share (EPS) above estimates.
Bond prices rose as the yield on 10-year Treasuries fell from 4.34% to 4.09%. The Bloomberg U.S. Aggregate Bond Index posted a 2.3% gain for the month. Other bond sub-asset classes also rose in July bringing year-to-date total returns for fixed income into positive territory across the board.
Asset Allocation – Positioning for Rate Cuts
July’s CPI report ignited a rotation from large cap tech stocks to small cap, cyclical sectors and non-tech stocks. Investors began positioning for a rate cutting cycle.
Before July, the 2024 rally has been primarily driven by technology stocks. But as of the end of July, the Fed is likely poised to cut rates multiple times over the next year and a half. As a result, interest has increased in asset classes which would benefit from lower interest rates and a “soft landing”. Positioning for rate cuts, some investors are seeking to move away from technology companies with stretched valuations and toward more reasonably priced cyclical sectors.
We do not believe it is possible to consistently “time” the markets. By the time you know that there is a fundamental shift in the markets, it is too late to profitably react. Violent market moves cannot be timed and happen with more frequency than many investors expect. Note how fast July’s market rotation happened! Small cap stocks rallied more than 10% in just six trading days and the equal weight S&P 500 (the “broader market”) surged higher, substantially narrowing the performance gap between it and the traditional market capitalization weighted S&P 500. The performance gap declined from nearly 14% to 9% in just a few trading days.
We believe that asset allocation using diversified asset classes provides an all-weather portfolio approach and better manages market risks. With a core large cap stock allocation which includes sufficient tech exposure, investors can benefit from the recent outsized returns of technology companies in the index. But with diversification through asset allocation, portfolios already have allocations in small and mid-cap stocks, real estate, and intermediate term bonds that may just be coming into favor. With an asset allocation approach, portfolios are already positioned for rate cuts without having to guess when the Fed will move or when investors will rationally or irrationally change course.
If you have any questions, please consult your JMG Advisor.
Important Disclosure
Please remember that past performance may not be indicative of future results. Different types of investments involve varying degrees of risk, and there can be no assurance that the future performance of any specific investment, investment strategy, or product (including the investments and/or investment strategies recommended or undertaken by JMG Financial Group Ltd. (“JMG”), or any non-investment related content, made reference to directly or indirectly in this writing will be profitable, equal any corresponding indicated historical performance level(s), be suitable for your portfolio or individual situation, or prove successful. Due to various factors, including changing market conditions and/or applicable laws, the content may no longer be reflective of current opinions or positions. Moreover, you should not assume that any discussion or information contained in this writing serves as the receipt of, or as a substitute for, personalized investment advice from JMG. To the extent that a reader has any questions regarding the applicability of any specific issue discussed above to his/her individual situation, he/she is encouraged to consult with the professional advisor of his/her choosing. JMG is neither a law firm, nor a certified public accounting firm, and no portion of the content provided in this writing should be construed as legal or accounting advice. A copy of JMG’s current written disclosure Brochure discussing our advisory services and fees is available upon request. If you are a JMG client, please remember to contact JMG, in writing, if there are any changes in your personal/financial situation or investment objectives for the purpose of reviewing/evaluating/revising our previous recommendations and/or services, or if you would like to impose, add, or to modify any reasonable restrictions to our investment advisory services. JMG shall continue to rely on the accuracy of information that you have provided.
To the extent provided in this writing, historical performance results for investment indices and/or categories have been provided for general comparison purposes only, and generally do not reflect the deduction of transaction and/or custodial charges, the deduction of an investment management fee, nor the impact of taxes, the incurrence of which would have the effect of decreasing historical performance results. It should not be assumed that your account holdings correspond directly to any comparative indices. Indices are not available for direct investment.
Market Segment (index representation) as follows: U.S. Large Cap (S&P Total Return); U.S. Mid-Cap (Russell Midcap Index Total Return); Foreign Developed (FTSE Developed Ex U.S. NR USD); Emerging Markets (FTSE Emerging NR USD); U.S. REITs (FTSE NAREIT Equity Total Return Index); Foreign REITs (FTSE EPRA/NAREIT Developed Real Estate Ex U.S. TR); U.S Bonds (Bloomberg US Aggregate Bond Index); U.S. TIPs (Bloomberg US Treasury Inflation-Linked Bond Index); Foreign Bond (USD Hedged) (Bloomberg Global Aggregate Ex US TR Hedged); Municipal Bonds (Bloomberg US Municipal Bond Index); High Yield Bonds (Bloomberg US Corporate High Yield Index).