Why Did 10-Year Treasury Yields Increase After the Initial Fed Interest Rate Cut?
INVESTMENT COMMITTEE COMMENTARY October 2024
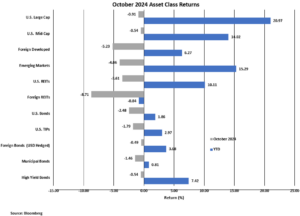
Equities began October on an upswing due to a better than expected September jobs report. Based on economic data early in the month, the Dow Jones Industrial Average and the S&P 500 hit record highs. However, investors began moving away from risk equities as disappointing earnings data from big tech companies raised concerns about rising Artificial Intelligence (AI) costs and the potential pressures on profits. With about 37% of the S&P 500 companies reporting, third-quarter earnings results have been mixed. While S&P 500 earnings grew for a fifth straight quarter, it has been at the lowest growth rate since the second quarter of 2023.
Overall, stocks closed lower in October as the S&P 500 fell 0.9% for the month.
The U.S. economy has continued to grow at a modest pace with the gross domestic product (GDP) increasing 2.8% in the third quarter. For the 12 months ending in September, inflation as measured by the Consumer Price Index (CPI) was 2.4%. The inflation indicator preferred by the Federal Reserve (Fed) is the PCE price index, which came in at 2.1%, just a tenth of a percent below the Fed’s target rate. Of note, CPI housing components, which compose about 33% of CPI, reflected a price increase of close to 5% over the year.
October proved to be a challenging month for bonds. Treasury yields climbed on concerns about the outlook for the U.S. government deficit and about whether stronger economic growth will slow Fed rate cuts. Bond prices fell as the yield on 10-year Treasury rose from 3.81% to 4.28%, the highest level in over three months. Accordingly, the Bloomberg U.S. Aggregate Bond Index fell 2.5%.

Why Did 10-Year Treasury Yields Increase After the Initial Fed Interest Rate Cut?
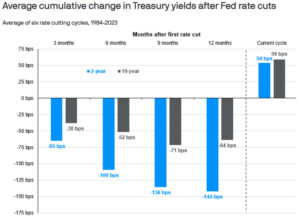
Following the Fed rate cut, the 10-year Treasury yield increased by 0.59% to the highest level since late July. As shown in the following chart by J.P. Morgan Asset Management, this yield increase appears inconsistent with the six prior rate cutting cycles going back to 1984.


Rising long-term interest rates are likely driven by a combination of factors, including (1) rising inflation expectations, (2) the Fed may reduce its pace or level of interest rate cuts in response to such inflation, and (3) the federal deficit is expected to grow, which will increase the supply of US debt, requiring higher rates to attract additional investors.
While investors may worry about the impact of interest rate changes by the Federal Reserve, it’s important to remember that longer-term interest rates and the Fed don’t necessarily move in lockstep. The market is constantly pricing new information (e.g. Fed interest rate changes, election outcomes, federal debt and deficits, inflation expectations) into bond yields. Over the longer term, the returns on a bond portfolio are likely not that closely correlated with the Fed funds rate.
Election Results and Policy Implications
As of this writing, there may be a Republican sweep of the presidency and both the Senate and House of Representatives. Because of the shift of power from Democrat to Republican control, expectations could include more significant policy changes in trade (including tariffs), income and estate taxes, social policies, foreign policy and federal regulations. While currently scheduled to sunset next year, the Tax Cuts and Jobs Act could possibly be extended, with potential new tax cuts. Financial plans may require adjustment to any new rules, regulations or limitations.
The recent stock rally is not without risks. The market views Republican policies as pro-economic growth, which may drive an increase in corporate profits, particularly for US based companies. Undoubtedly, there will be new surprises that will spike market volatility. Investment diversification is always a prudent course.
If you have any questions or wish to review your portfolio asset allocations, please consult your JMG Advisor.
Important Disclosure
Please remember that past performance may not be indicative of future results. Different types of investments involve varying degrees of risk, and there can be no assurance that the future performance of any specific investment, investment strategy, or product (including the investments and/or investment strategies recommended or undertaken by JMG Financial Group Ltd. (“JMG”), or any non-investment related content, made reference to directly or indirectly in this writing will be profitable, equal any corresponding indicated historical performance level(s), be suitable for your portfolio or individual situation, or prove successful. Due to various factors, including changing market conditions and/or applicable laws, the content may no longer be reflective of current opinions or positions. Moreover, you should not assume that any discussion or information contained in this writing serves as the receipt of, or as a substitute for, personalized investment advice from JMG. To the extent that a reader has any questions regarding the applicability of any specific issue discussed above to his/her individual situation, he/she is encouraged to consult with the professional advisor of his/her choosing. JMG is neither a law firm, nor a certified public accounting firm, and no portion of the content provided in this writing should be construed as legal or accounting advice. A copy of JMG’s current written disclosure Brochure discussing our advisory services and fees is available upon request. If you are a JMG client, please remember to contact JMG, in writing, if there are any changes in your personal/financial situation or investment objectives for the purpose of reviewing/evaluating/revising our previous recommendations and/or services, or if you would like to impose, add, or to modify any reasonable restrictions to our investment advisory services. JMG shall continue to rely on the accuracy of information that you have provided.
To the extent provided in this writing, historical performance results for investment indices and/or categories have been provided for general comparison purposes only, and generally do not reflect the deduction of transaction and/or custodial charges, the deduction of an investment management fee, nor the impact of taxes, the incurrence of which would have the effect of decreasing historical performance results. It should not be assumed that your account holdings correspond directly to any comparative indices. Indices are not available for direct investment.
Market Segment (index representation) as follows: U.S. Large Cap (S&P Total Return); U.S. Mid-Cap (Russell Midcap Index Total Return); Foreign Developed (FTSE Developed Ex U.S. NR USD); Emerging Markets (FTSE Emerging NR USD); U.S. REITs (FTSE NAREIT Equity Total Return Index); Foreign REITs (FTSE EPRA/NAREIT Developed Real Estate Ex U.S. TR); U.S Bonds (Bloomberg US Aggregate Bond Index); U.S. TIPs (Bloomberg US Treasury Inflation-Linked Bond Index); Foreign Bond (USD Hedged) (Bloomberg Global Aggregate Ex US TR Hedged); Municipal Bonds (Bloomberg US Municipal Bond Index); High Yield Bonds (Bloomberg US Corporate High Yield Index).
