

After the Fed Rate Cut: Soft vs. Hard Landing
INVESTMENT COMMITTEE COMMENTARY September 2024
Both stocks and bonds generally had strong performance in September, in part driven by monetary and other stimulus in the U.S. and China. Going forward the balance of risks has shifted from inflation to whether the economy can achieve a soft landing as the world navigates increased geopolitical uncertainty.
The stock market rally continued in September on expectations for a Federal Reserve (Fed) rate cut. A disappointing August jobs report, released in early September, increased concerns about an economic slowdown leading to modest stock volatility early in the month. However, following that report, numerous financial journalists and ex-Fed officials made public calls for the Fed to cut interest rates by 0.50% at the September meeting. Expectations for a larger-than-expected rate cut helped offset underwhelming economic data and the S&P 500 hit a new all-time high ahead of the Fed decision. Then, on September 18th, the Fed met market expectations and cut rates for the first time in four years with expectations for additional rate cuts through year-end. Investors welcomed this news as the S&P 500 surged to a new high and finished the month and quarter with solid gains, adding to the strong year-to-date returns.
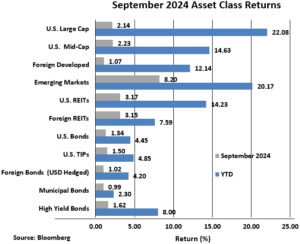
China’s stock market, which had been struggling for several months, shot higher at the end of September on the heels of the most aggressive stimulus measures since the pandemic. This included both interest rate cuts and fiscal support, in an attempt to rejuvenate China’s sagging economy. China’s Shanghai Composite Index jumped 18.7%. With the impact from China, the FTSE Emerging Markets Index rose 8.2% in September and the index now has a year-to-date total return of 20.2%.
Bond prices rose as the yield on 10-year Treasuries fell from 3.92% to 3.81% in September. The Bloomberg U.S. Aggregate Bond Index posted a 1.3% gain for the month. Other bond sub-asset classes also rose in September. Year-to-date total returns for fixed income investments are positive, generally over 4%. Of note, U.S. high yield corporate bonds are now up 8.0% through September.
After the Fed Rate Cut: Soft vs. Hard Landing
With the start of the Fed’s rate cutting cycle now behind us and the general plan for future cuts now coming into focus, economic growth is becoming the primary factor (rather than inflation) that will drive investment markets. Will the U.S. experience a soft or hard economic landing? A soft landing would be characterized by slowing or flat economic growth but avoiding recession. A hard landing would be characterized by recession and higher potential stress on employment and in economically sensitive sectors such as manufacturing.
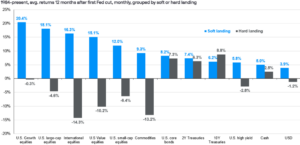
Investors may wonder how markets have performed in different rate cutting environments. J.P. Morgan Asset Management recently wrote that rate cutting cycles are not all created equal. The following chart looks at historical returns during the first year of these cycles since 1984. They compare results based upon whether there was a soft or hard landing. Note how equity assets perform quite well in soft landing scenarios. Alternatively, fixed income assets can perform well in either scenario, potentially offsetting equities in a hard landing.
September market performance suggests that investors are leaning toward soft landing scenarios. Unfortunately, it is too early to rule out a recession. With the S&P 500 just off record highs, the market has priced in a soft landing economic scenario. However, if the economic data in the fourth quarter is weaker than expected, the markets will likely become more volatile due to recession fears.
Politics, meanwhile, may become a more direct market influence as we approach the November 5th election. Depending on the expected and actual outcome, we could see an increase in macro and microeconomic volatility that could impact the broader markets as well as specific industries and sectors (e.g. oil and gas, renewables, financials and others). That volatility will stem from the uncertainty surrounding potential future policy changes (or lack thereof) relating to important financial and economic issues such as taxes, global trade and the long-term fiscal health of the United States.
Finally, geopolitical risks remain elevated with the ongoing conflicts in Europe and in the Middle East but, so far, the impact on global markets has been limited. These situations must be monitored as the spread of these conflicts could impact markets and oil prices, regardless of any Fed rate cuts or election outcomes.
While political headlines may cause short-term investor anxiety and volatility, market history is extremely clear: Over time, the S&P 500 has consistently advanced regardless of which party controls the government and the average annual performance of the S&P 500 is solidly positive in both Republican and Democratic administrations.
While there is elevated uncertainty between now and year-end, the fundamental underpinnings of this market remain generally positive. It is reasonable to expect periods of elevated volatility over the coming months (but, as we saw in the third quarter, markets can still move higher even amidst increased volatility). It is appropriate to remain broadly diversified and to continue to rebalance portfolios from previous winners.
If you have any questions or wish to review your portfolio asset allocations, please consult your JMG Advisor.
Important Disclosure
Please remember that past performance may not be indicative of future results. Different types of investments involve varying degrees of risk, and there can be no assurance that the future performance of any specific investment, investment strategy, or product (including the investments and/or investment strategies recommended or undertaken by JMG Financial Group Ltd. (“JMG”), or any non-investment related content, made reference to directly or indirectly in this writing will be profitable, equal any corresponding indicated historical performance level(s), be suitable for your portfolio or individual situation, or prove successful. Due to various factors, including changing market conditions and/or applicable laws, the content may no longer be reflective of current opinions or positions. Moreover, you should not assume that any discussion or information contained in this writing serves as the receipt of, or as a substitute for, personalized investment advice from JMG. To the extent that a reader has any questions regarding the applicability of any specific issue discussed above to his/her individual situation, he/she is encouraged to consult with the professional advisor of his/her choosing. JMG is neither a law firm, nor a certified public accounting firm, and no portion of the content provided in this writing should be construed as legal or accounting advice. A copy of JMG’s current written disclosure Brochure discussing our advisory services and fees is available upon request. If you are a JMG client, please remember to contact JMG, in writing, if there are any changes in your personal/financial situation or investment objectives for the purpose of reviewing/evaluating/revising our previous recommendations and/or services, or if you would like to impose, add, or to modify any reasonable restrictions to our investment advisory services. JMG shall continue to rely on the accuracy of information that you have provided.
To the extent provided in this writing, historical performance results for investment indices and/or categories have been provided for general comparison purposes only, and generally do not reflect the deduction of transaction and/or custodial charges, the deduction of an investment management fee, nor the impact of taxes, the incurrence of which would have the effect of decreasing historical performance results. It should not be assumed that your account holdings correspond directly to any comparative indices. Indices are not available for direct investment.
Market Segment (index representation) as follows: U.S. Large Cap (S&P Total Return); U.S. Mid-Cap (Russell Midcap Index Total Return); Foreign Developed (FTSE Developed Ex U.S. NR USD); Emerging Markets (FTSE Emerging NR USD); U.S. REITs (FTSE NAREIT Equity Total Return Index); Foreign REITs (FTSE EPRA/NAREIT Developed Real Estate Ex U.S. TR); U.S Bonds (Bloomberg US Aggregate Bond Index); U.S. TIPs (Bloomberg US Treasury Inflation-Linked Bond Index); Foreign Bond (USD Hedged) (Bloomberg Global Aggregate Ex US TR Hedged); Municipal Bonds (Bloomberg US Municipal Bond Index); High Yield Bonds (Bloomberg US Corporate High Yield Index).