Rates are Falling: Should you consider Bonds over Cash?
INVESTMENT COMMITTEE COMMENTARY August 2024
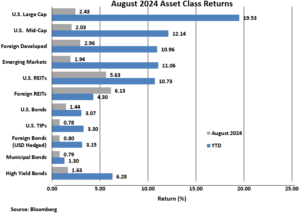
The S&P 500 closed August near an all-time high and recovered from a sell-off early in the month. For the month, the S&P 500 rose 2.4%.
Market volatility increased at the beginning of August. Many markets experienced a broad “risk off” trade leading to declines in U.S. and Japanese equities. The ten-year Treasury yield fell to 3.78% on August 5th in response to some weaker than expected economic data and rate hikes by the Bank of Japan. At that time, we thought the sell-off was driven by a combination of profit taking, the covering of extended positions by select market participants, and a broad recognition of risks shifting from inflation towards slowing economic growth. After August 5th, three factors influenced the market rebound: solid economic and inflation data offsetting concerns from the August jobs report, the Federal Reserve (Fed) announcing “the time has come” to begin cutting interest rates, and decent corporate earnings.
In the last two years, the technology sector and stocks tied to artificial intelligence (AI) have led the U.S. stock market rally. Morningstar reports the most recent tech market peak came in mid-July. Since then, there has been a rotation away from large cap tech and AI stocks. As tech prices became more overvalued, investors began shifting to less expensive mid and small cap stocks and real estate investment trusts (REITs). Such market shifts come about quickly and cannot be timed. As noted above, the S&P 500 rose 2.4% in August even though six of the top seven contributors to the market rally since 2022 (Nvidia, Microsoft, Alphabet, Apple, Amazon and Broadcom) have been leading detractors relative to the overall S&P 500 since mid-July.
Bond prices rose as the yield on 10-year Treasuries fell from 4.09% to 3.92% in August. The Bloomberg U.S. Aggregate Bond Index posted a 1.4% gain for the month. Other bond sub-asset classes also rose in August. Year-to-date total returns for fixed income investments are positive, generally over 3%. Of note, U.S. high yield corporate bonds are up 6.3% through August.
In 2021 and 2022, the Fed raised short term rates from 0.25% to 5.25% to combat inflation. The Fed action caused the yield curve to “invert” so that short-term bond rates became higher than long-term rates. Treasury yields have been inverted since July 2022, the longest period on record. Now that the Fed has brought inflation under control, the Fed has shifted focus to reducing rates to a level which will support continued economic growth. As a result, we are seeing the yield curve beginning to normalize. As of August 31st, the yields on 2-year and 10-year Treasuries are effectively the same at 3.91%. Yields on Treasuries with maturities less than 2 years remain higher, but as the Fed lowers short term rates, the yield curve will return to its normal state with longer term bonds paying higher rates.

Rates are Falling: Should you consider Bonds over Cash?
The anticipated Fed interest rate cuts in September will change the interest rate environment. US Bank notes that investors hold more than $6 trillion in money market funds as some investors have moved to higher short-term interest rates since 2022. Going forward, there may be more profitable choices to consider for investor cash reserves parked in money market funds and certificates of deposit (CDs).
Money market funds and CDs serve an important role to meet immediate cash needs in savings and reserve accounts. The key attribute of these funds is liquidity and the ability to convert to cash quickly. The yield on these funds is tied to short-term market rates, currently about 5.1%. However, in a falling rate environment, these securities suffer from risk that their proceeds will not be reinvested at the same high rate, often referred to as reinvestment risk. Longer-term bonds benefit from the ability to lock in current rates, causing them to appreciate if rates fall further.
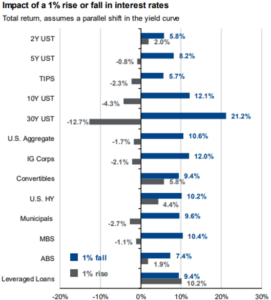
For cash held above reserve fund needs, some investors are shifting their cash toward longer-term bonds which generate higher returns in falling interest rate environments. The chart below illustrates the return impact on various fixed income sub-asset classes depending on whether interest rates rise or fall by 1%. For example, 2-year and 10-year Treasuries both have a yield of 3.91% on August 31st. If interest rates fall by 1%, the total return on 2 and 10-year Treasuries would increase to +5.8% and +12.1%, respectively. If interest rates rise by 1%, the total return on 2 and 10-year Treasuries would fall to +2.0% and –4.3%, respectively. Longer duration bonds are more interest rate sensitive.


We believe it is a good time to reassess cash and cash equivalent holdings. Interest rates already have come down (about 1% since late April on 10-year Treasuries) resulting in positive fixed income returns. In this environment, we favor holding limited or intermediate duration bonds over excess cash.
If you have any questions or wish to review your portfolio asset allocations, please consult your JMG Advisor.
Important Disclosure
Please remember that past performance may not be indicative of future results. Different types of investments involve varying degrees of risk, and there can be no assurance that the future performance of any specific investment, investment strategy, or product (including the investments and/or investment strategies recommended or undertaken by JMG Financial Group Ltd. (“JMG”), or any non-investment related content, made reference to directly or indirectly in this writing will be profitable, equal any corresponding indicated historical performance level(s), be suitable for your portfolio or individual situation, or prove successful. Due to various factors, including changing market conditions and/or applicable laws, the content may no longer be reflective of current opinions or positions. Moreover, you should not assume that any discussion or information contained in this writing serves as the receipt of, or as a substitute for, personalized investment advice from JMG. To the extent that a reader has any questions regarding the applicability of any specific issue discussed above to his/her individual situation, he/she is encouraged to consult with the professional advisor of his/her choosing. JMG is neither a law firm, nor a certified public accounting firm, and no portion of the content provided in this writing should be construed as legal or accounting advice. A copy of JMG’s current written disclosure Brochure discussing our advisory services and fees is available upon request. If you are a JMG client, please remember to contact JMG, in writing, if there are any changes in your personal/financial situation or investment objectives for the purpose of reviewing/evaluating/revising our previous recommendations and/or services, or if you would like to impose, add, or to modify any reasonable restrictions to our investment advisory services. JMG shall continue to rely on the accuracy of information that you have provided.
To the extent provided in this writing, historical performance results for investment indices and/or categories have been provided for general comparison purposes only, and generally do not reflect the deduction of transaction and/or custodial charges, the deduction of an investment management fee, nor the impact of taxes, the incurrence of which would have the effect of decreasing historical performance results. It should not be assumed that your account holdings correspond directly to any comparative indices. Indices are not available for direct investment.
Market Segment (index representation) as follows: U.S. Large Cap (S&P Total Return); U.S. Mid-Cap (Russell Midcap Index Total Return); Foreign Developed (FTSE Developed Ex U.S. NR USD); Emerging Markets (FTSE Emerging NR USD); U.S. REITs (FTSE NAREIT Equity Total Return Index); Foreign REITs (FTSE EPRA/NAREIT Developed Real Estate Ex U.S. TR); U.S Bonds (Bloomberg US Aggregate Bond Index); U.S. TIPs (Bloomberg US Treasury Inflation-Linked Bond Index); Foreign Bond (USD Hedged) (Bloomberg Global Aggregate Ex US TR Hedged); Municipal Bonds (Bloomberg US Municipal Bond Index); High Yield Bonds (Bloomberg US Corporate High Yield Index).
