Mid-Year Commentary
INVESTMENT COMMITTEE COMMENTARY June 2024
The S&P 500 had another strong month in June, led again by the artificial intelligence-linked (AI) stocks, while the broader equity and bond markets experienced mixed results. The strong AI earnings came from Oracle and Broadcom along with news Apple was integrating AI technology into future iPhones. Tech stocks pushed higher and that, combined with falling Treasury yields and (once again) rising expectations of Fed rate cuts, sent the S&P 500 to new all-time highs above 5,500.
Regarding inflation, the May consumer price index (CPI – released in mid-June) declined to 3.3% year over year, the lowest level since February. Core CPI, which excludes food and energy prices, dropped to 3.4%, the lowest level since April 2021, further confirming ongoing disinflation. At the June Fed meeting, Chair Jerome Powell reassured markets that two rate cuts are entirely possible in 2024, reinforcing market expectations for a September rate cut. Economic data, meanwhile, showed continued moderation of activity. Slowing growth and falling inflation helped to push the 10-year Treasury yield to 4.20%, a multi-month low.
The June employment report gave indications that the restraints applied by the Fed through higher interest rates are having the desired effect of slowing economic growth. In particular, the employment gain of 206,000 jobs was offset by prior month downward revisions of 111,000 jobs representing a decline relative to recent months. If the data continues to show inflation is subsiding along with the slowdown in employment, the Fed is more likely to make a policy move to lower interest rates in September.
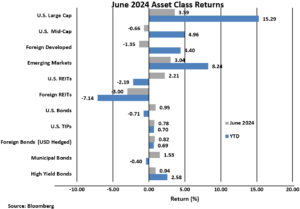
While the S&P 500 rose 3.6% in June, other equity asset classes had mixed performance results for the month. Less tech focused and smaller cap stocks did not fare as well as the S&P 500. Foreign developed stocks fell 1.4% but emerging market equities gained 3.0%. Interest rate sensitive U.S. REITs rose 2.2% although year-to-date performance remains negative.
Bond prices in June rose as the yield on 10-year Treasuries fell from 4.51% to 4.34%. The Bloomberg U.S. Aggregate Bond Index (AGG) posted a 1.0% return for the month. Other bond sub-indexes also rose in June although the AGG and municipal bonds have had modestly negative returns year-to-date.

Mid-Year Commentary
The S&P 500 ended the first half of 2024 near its all-time high. The following are important factors that have driven overall market performance this year.
- Inflation has been slowly declining but remains sticky. Contributors to headline CPI inflation in 2024 have been shelter costs, food away from home (dining) and auto insurance. This is very different from two years ago when inflation was driven by energy and core goods. The Fed has been hesitant to lower interest rates because headline CPI is trending sideways at about 3.3%.
- At the beginning of the year, investors were expecting five or six Fed interest rate cuts in 2024, beginning in March. The expected rate cuts did not happen, and the April equity market decline can be explained by investors adjusting their expectations to one or two rate cuts for the year. In particular, the delay in rate cuts has negatively impacted some mid and small cap companies which would benefit from lower interest rates.
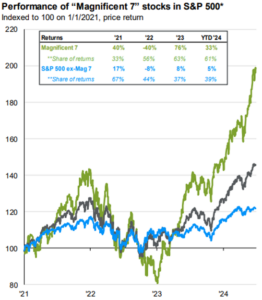
- In the first quarter, it seemed the breadth of the equity markets was improving in that broad index performance was not just relying on a small number of stocks (the Magnificent Seven – Mag 7 – Apple, Amazon, Alphabet, Meta, Microsoft, Nvidia, and Tesla). However, in the second quarter, large cap index performance was once again driven by the Mag 7. Year-to-date performance of the Mag 7 is about 33% compared to the S&P 500 ex-Mag 7 performance of about 5%.


Third Quarter Market Outlook
Stocks begin the third quarter of 2024 riding a wave of optimism and generally positive news. There is also potential for the Fed to deliver the first rate cut in over four years this September. Economic growth remains generally solid and substantial earnings growth from AI-linked tech companies has shown no signs of slowing.
Those positives are reflected in the fact that the S&P 500 has made more than 30 new highs so far in 2024 and is trading at levels that, historically speaking, are richly valued. That said, if inflation continues to decline, economic growth stays solid and the Fed delivers on a September cut, absent any other major surprises, it is reasonable to expect this strong 2024 rally to continue in the third quarter.
However, while the outlook for stocks is positive for now, market history has shown that nothing is guaranteed. As such, events can quickly change the market dynamics with unexpected and sudden volatility. To that point, the market does face risks as we start the third quarter. Slowing economic growth, disappointment if the Fed does not cut rates in September, underwhelming second quarter earnings results (out in July), a rebound in inflation and geopolitical surprises are all potential negatives. Investor allocations to equities are at high levels, reducing the liquidity available for further equity investment. Given high levels of investor optimism and current market valuations, any of these factors could cause a pullback in markets similar to what was experienced in April.
While any of those risks could result in a drop in stock or bond prices, the risk of slowing economic growth is perhaps the most substantial threat to the 2024 rally. For the first time in years, economic data is pointing to a loss of economic momentum. So far, the market has welcomed moderation in growth because it has increased the chances of a September rate cut.
Bottom line: the outlook for stocks remains positive but that should not be confused with a risk-free environment. We recommend investment in the Mag 7 stocks through the S&P 500 but we also believe diversification in broader asset classes, both U.S. and foreign, are important components for investor portfolios. Bond yields are also reasonably attractive and should provide a level of protection in the event of an equity market decline.
If you have any questions, please consult your JMG Advisor.
Important Disclosure
Please remember that past performance may not be indicative of future results. Different types of investments involve varying degrees of risk, and there can be no assurance that the future performance of any specific investment, investment strategy, or product (including the investments and/or investment strategies recommended or undertaken by JMG Financial Group Ltd. (“JMG”), or any non-investment related content, made reference to directly or indirectly in this writing will be profitable, equal any corresponding indicated historical performance level(s), be suitable for your portfolio or individual situation, or prove successful. Due to various factors, including changing market conditions and/or applicable laws, the content may no longer be reflective of current opinions or positions. Moreover, you should not assume that any discussion or information contained in this writing serves as the receipt of, or as a substitute for, personalized investment advice from JMG. To the extent that a reader has any questions regarding the applicability of any specific issue discussed above to his/her individual situation, he/she is encouraged to consult with the professional advisor of his/her choosing. JMG is neither a law firm, nor a certified public accounting firm, and no portion of the content provided in this writing should be construed as legal or accounting advice. A copy of JMG’s current written disclosure Brochure discussing our advisory services and fees is available upon request. If you are a JMG client, please remember to contact JMG, in writing, if there are any changes in your personal/financial situation or investment objectives for the purpose of reviewing/evaluating/revising our previous recommendations and/or services, or if you would like to impose, add, or to modify any reasonable restrictions to our investment advisory services. JMG shall continue to rely on the accuracy of information that you have provided.
To the extent provided in this writing, historical performance results for investment indices and/or categories have been provided for general comparison purposes only, and generally do not reflect the deduction of transaction and/or custodial charges, the deduction of an investment management fee, nor the impact of taxes, the incurrence of which would have the effect of decreasing historical performance results. It should not be assumed that your account holdings correspond directly to any comparative indices. Indices are not available for direct investment.
Market Segment (index representation) as follows: U.S. Large Cap (S&P Total Return); U.S. Mid-Cap (Russell Midcap Index Total Return); Foreign Developed (FTSE Developed Ex U.S. NR USD); Emerging Markets (FTSE Emerging NR USD); U.S. REITs (FTSE NAREIT Equity Total Return Index); Foreign REITs (FTSE EPRA/NAREIT Developed Real Estate Ex U.S. TR); U.S Bonds (Bloomberg US Aggregate Bond Index); U.S. TIPs (Bloomberg US Treasury Inflation-Linked Bond Index); Foreign Bond (USD Hedged) (Bloomberg Global Aggregate Ex US TR Hedged); Municipal Bonds (Bloomberg US Municipal Bond Index); High Yield Bonds (Bloomberg US Corporate High Yield Index).
